Timeline of U.S. Federal Debt Since Independence Day 1776
As we get closer to America’s 245th year of independence, it’s a good time to reflect on how debt is woven into our country’s fabric. Especially since we’re now weaving it faster than Betsy Ross ever sewed that first American flag.
Thanks to the cavalcade of economic relief bills prompted by the COVID-19 crisis, the federal debt hit $28.2 trillion in 2021, according to the Congressional Budget Office. That’s an increase of almost $7 trillion in two years.
Consider that our entire national debt didn’t hit $7 trillion until 2004. In other words, the U.S. has accumulated as much debt in the past two years as it did in its first 228 years.
If the debt were a car and America suddenly had to pay for it, every man, woman and child would quickly have to come up with $85,200. Either that, or the country would be repossessed.
Our Founding Fathers knew debt would be part of the game, though their calculators did not have the 13 digits required to signify one trillion.
Shortly after the American Revolutionary War (1775-1783), public debt grew to more than $75 million and continued to swell considerably over the next four decades to nearly $120 million. However, President Andrew Jackson shrank that debt to zero in 1835.
It was the only time in U.S. history when the country was free of debt.
More than 200 years after the inception of our country and several wars, stock market crashes, powerful companies suffering from failed investments, rising unemployment rates, the famous bursting of a tech bubble, the bursting of a housing bubble and pandemic relief bills, federal debt is careening toward $30 trillion.
If Thomas Jefferson had a calculator, it would have read $30,000,000,000,000.
U.S. Debt by Presidential Term
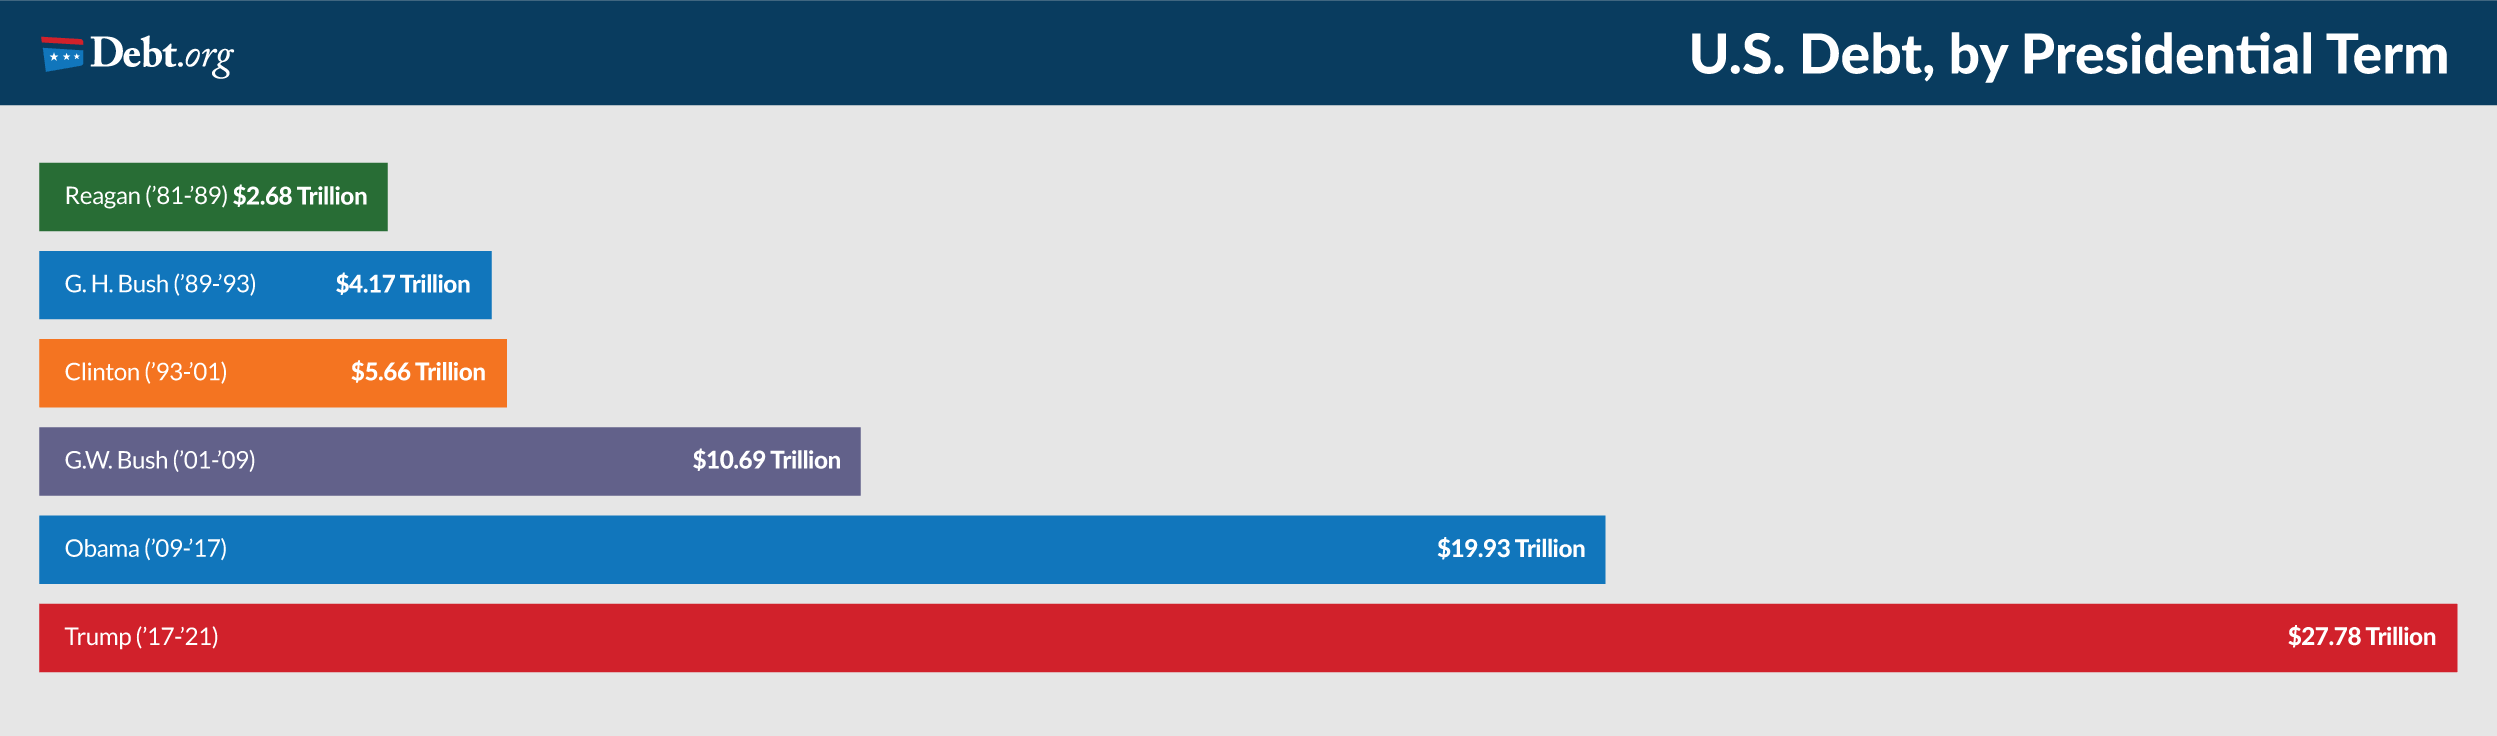
The national debt between the Ronald Reagan era and Bill Clinton’s administration slowly increased, but it nearly doubled during the presidential term of George W. Bush to more than $9 trillion.
By the time Barack Obama left office, the debt was $19 trillion. Spurred by the COVID-19 crisis, Donald Trump left a debt of $27.8 trillion.
Here, then, is a brief timeline of how American debt has grown since John Hancock signed the Declaration of Independence on July 4, 1776.
Revolutionary War Kicks Off U.S. Debt
Wars were always a major debt factor for our nation. Congress could not finance the Revolutionary war with large tax raises, as the memory of unjust taxation from the British stood fresh in the minds of the American public. Instead, the Continental Congress (made up of delegates from the Thirteen Colonies) borrowed money from other nations.
The founders led negotiations with Benjamin Franklin securing loans of over $2 million from the French Government and President John Adams securing a loan from Dutch bankers. We also borrowed from domestic creditors. While the war was still going on, in 1781, Congress established the U.S. Department of Finance.
Two years later, as the war ended in 1783, the Department of Finance reported U.S. debt to the American Public for the first time. Congress took initiative to raise taxes then, as the total debt reached $43 million.
President Andrew Jackson Cuts Debt to Zero
The War of 1812 more than doubled the nation’s debt. It increased from $45.2 million to $119.2 million by September 1815. The Treasury Department issued bonds to pay a portion of the debt, but it was not until Andrew Jackson became president and determined to master the debt that this “national curse,” as he deemed it, was addressed.
By selling federally owned western lands and blocking spending on infrastructure projects, Jackson paid off the national debt after six years in office. This actually created a government surplus that Jackson divided among indebted states.
The time of prosperity was short-lived, as state banks began printing money and offering easy credit, and land value dropped.
Recovery from the Civil War
The Civil War (1861-1865) alone is estimated to have cost $5.2 billion when it ended and government debt skyrocketed from $65 million to $2.6 billion. Post-Civil War inflation along with economic disturbance from Europe’s financial struggles contributed to the vulnerable economic climate of the late 19th century.
The collapse of Jay Cooke & Co., a major bank invested in railroading, caused the Panic of 1873. Nearly a quarter of the country’s railroads went bankrupt, more than 18,000 businesses closed, unemployment hit 14 percent and the New York Stock Exchange began sinking.
This period of deflation and low growth continued for 65 months making it the longest depression, according to the National Bureau of Economic Research. During this time the government collected less money in taxes and the national debt grew.
Great Depression and Stock Market Crash
People started investing heavily in the stock market in 1920 unaware that Black Tuesday would dawn with an $8 billion loss in market value when the stock market crashed on October 29, 1929. The United States relied on the gold standard and raised inflation, rather than lowering rates to ease the burden of inflation.
During the following era, income inequality between classes grew. More than 25 percent of the workforce was unemployed, people made purchases on credit and were forced into foreclosures and repossessions.
President Franklin D. Roosevelt developed programs for unemployment pay and social security pensions, along with providing assistance to labor unions. Although Roosevelt addressed many problems in the U.S. economy, the funding for his programs grew the national debt to $33 billion.
World War II Debt
During World War II (1939 to 1945), the U.S. lent Britain and other countries money to help pay for military costs, and spent a great deal for their own military. By the end of that war, U.S. debt reached $285 billion.
Following that war, the U.S. economy grew, but the trend of a post-war reduction of national debt did not continue. Within a few decades, the Vietnam War and programs to help the poor, fund education and improve transportation increased debt further.
Debt Grows into the Trillions During 1980s and 1990s
At the start of the 1980s, an increase in defense spending and substantial tax cuts continued to balloon the federal debt. The national debt at the end of the Ronald Reagan era was $2.7 trillion.
The era under President Bill Clinton was marked with tax increases, reductions in defense spending and an economic boom that reduced the growth of debt, but it still reached a staggering $5.6 trillion by 2000.
U.S. Federal Debt, 1990-Now
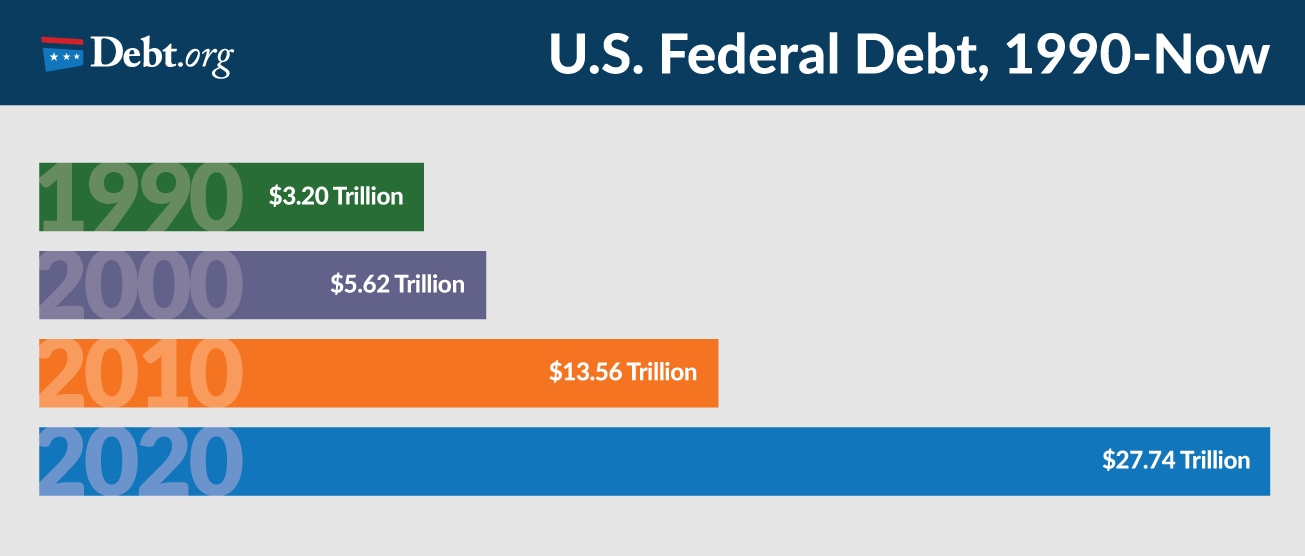
The increase in federal debt between 1990 and 2000 was minimal when considering how it more than doubled in the next 10 years.
The increase in federal debt between 1990 and 2000 was minimal when considering how it more than doubled in 2010 to $13.5 trillion.
The Great Recession
Debt in the new millennium exploded with the September 11, 2001 terrorist attacks. Spending on homeland security and the Iraq War increased and the economy stalled. Also, a large portion of the federal debt stemmed from money borrowed by the government from Social Security and Medicare.
By 2005, the federal deficit was at more than $8.1 trillion.
The U.S. experienced a recession from December 2007 to June 2009 characterized by high unemployment rates, the burst of the housing bubble and major government bail-outs.
Housing prices prior to 2008 were dwindling and subprime lending for mortgages was prevalent. But suddenly, adjustable rates on mortgages increased and doubled or tripled mortgage payments. Homeowners defaulted on their loans and hundreds of banks failed.
The government bailed out several major companies, including American International Group (AIG) Financial Products, which was the country’s biggest insurer, Fannie Mae and Freddie Mac (government sponsored mortgage entities). Within only a few years, housing prices dropped by around 20 percent and unemployment nearly doubled from 5.8 percent to 9.3 percent.
President George W. Bush passed the Troubled Asset Relief Program in 2008 to help the economy recover. That program cost around $700 billion. President Barack Obama later passed the American Recovery and Reinvestment Act of 2009, costing around $831 billion.
By the end of 2009, the federal debt had grown to $12.3 trillion.
Today’s National Debt
The fast-spinning National Debt Clock hit $28.2 trillion in April of 2021. It was climbing steadily before anyone ever heard of the Wuhan wet market, but the pandemic turned Washington D.C. into a money printing machine.
The CARES Act of March 2020 added $2.2 trillion to the tab. By the end of the year, federal stimulus bills pushed last year’s deficit alone to $3.1 trillion, and there was more spending in the pipeline.
President Joe Biden pushed through a $1.9 trillion American Rescue Plan Act in March 2021. Another $2 trillion in infrastructure and green energy plans was also in the works.
Can America Keep Piling Up Debt?
Economists debate whether the spending is sustainable. The U.S. finances the debt by selling bonds at auction. Demand has traditionally been high due to the size of our economy and a historically stable government, but the Treasury’s auction of bonds in March 2021 was met with a tepid response.
Historically low interest rates meant the U.S. borrowed money cheaply, and it would theoretically invest it in an economy that would produce higher rates of return.
But interest rates are not expected to stay low forever. The 10-year rate on Treasury notes was expected to rise from 1.7% in March 2021 to at least 2.0% by the end of 2021, according to Kiplinger’s forecast.
The cost to just finance our debt is expected to be $378 billion in 2021 and increase to $665 billion by the end of the decade, according to CBO estimates. That money will be spent only on interest, not on the principal.
The U.S. is by far the most indebted organization in world history. While debt has been an issue since the inception of the U.S., its rapid growth will continue to challenge lawmakers into creating better programs to reign in expenditures, as well as American consumers who must develop improved way of managing their personal debt.


Sources:
- N.A. (2021, April 5) Monthly Statement of the Public Debt (MSPD) and Downloadable Files. Retrieved from https://www.treasurydirect.gov/govt/reports/pd/mspd/mspd.htm
- Payne, D. (2021, March 18). Interest Rates: Inflation Fears Outweigh the Fed’s Dovishness. Retrieved from https://www.kiplinger.com/economic-forecasts/interest-rates
- Kimmins, I. (2021, March 26). Global bond markets weaken after tepid Treasury auction. Retrieved from https://californianewstimes.com/global-bond-markets-weaken-after-tepid-treasury-auction/235054/
- Lu, M. (2020, October 30). Charting America’s Debt: $27 Trillion and Counting. Retrieved from https://www.visualcapitalist.com/americas-debt-27-trillion-and-counting/
- Andolfatto, D. (2020, December 4). Does the National Debt Matter? Retrieved from https://www.stlouisfed.org/publications/regional-economist/fourth-quarter-2020/does-national-debt-matter